Important Note Before Reading This Guide
As you read this Guide, make sure you understand every word and never skip over a word you don’t understand.
If you start to feel lost or confused, it’s likely because you skipped over a word or phrase you didn’t understand.
When that happens, stop and don’t keep pushing forward. Go back to where things still made sense, find the word or phrase you missed, and look it up before moving on.
The best way to look up and understand every word, phrase, or concept in this guide is to use Para from LegalMente AI.
Para is FREE to use by signing up here: https://app.legalmente.ai/signup
Once you find the word or phrase you don’t understand, ask Para to help you understand it by entering the following prompt. Just replace [WORD, PHRASE, OR CONCEPT] in brackets with the word, phrase, or concept you did not understand.
Define [WORD, PHRASE OR CONCEPT]. When providing the definition, keep it to 1 sentence. In your definition, do not include other words or concepts that would require new definitions. The definition you provide should be self-contained and easy-to-follow. After your definition, provide a 1 sentence example of the word, phrase, or concept you just defined, and ensure the example is parsimonious and easy to understand.
Introduction and Purpose
Isn’t it frustrating when you learn things as you get older and wish that you had learned those things earlier in life? The Ultimate Guide to Getting Starting in Data Science, Analytics and AI is designed to prevent that. It’s written to provide you what you should learn now that will be mostly immutable throughout your life and career in data science, analytics, and AI. This excludes technological software, of course, as that constantly changes, but even then, we teach you software and tools that are “future proof” and will have a high chance of still being used 1 to 2 decades from now.
The average life expectancy in the US is 77 years old, according to the World Bank. The average human will learn things over their lifetimes through the lens of just 77 years of experience, but humanity has existed for thousands of years. That means you may learn things at 25 years old, 35 years old, 55 years old or even 70 years old that other humans learned hundreds or even thousands of years ago.
The way to prevent that is to learn immutable concepts that have a high probability of not changing in the next few hundred years. And the best way to discern that is to look for knowledge and concepts that have withstood the test of time.
At Remix Institute, we designed an Axiomatic System of Philosophies that have withstood the test of time. Lessons that you can learn now that will be still as valuable and applicable a few hundred years from now. We cover many of those in this Guide. But this applies to the technological world as well, particularly when it comes to building technology products and their subsequent behavioral patterns.
The purpose of this document is also to provide an overview of the inner workings of an Analytics or Data Science and AI teams at a typical organization.
That’s why we call this “Ultimate Guide” because it becomes a premise or starting point for your life’s pursuit of knowledge, wisdom, and success.
What is Analytics?
Analytics teams primarily support business units in an organization by generating customer insights, providing data-driven and strategic recommendations for future growth and improvement, automate data-related business processes, and create dashboards, reports, and visualizations to monitor business key performance indicators (KPIs).
By giving data-centric strategic guidance to executives and senior management, Analytics teams can help increase profit growth and optimize the customer experience.
How are Analytics teams different from Data teams?
There are many opinions on this, but the consensus is that Data teams manage data engineering, data warehousing, database administration and architecture, ETL (extract, transform, load), Business Intelligence (BI), and basic reporting.
Analytics involves granular-level analysis and insights mining, root-cause analysis, and may involve statistical analysis, data science, and machine learning.
The best analogy would be a basketball game: Data teams and Business Intelligence teams serve as the Scoreboard and gathering the data on the players. Analytics is like ESPN Analysts giving their insights on the game via commentary and player analysis.
However, Analytics teams are consumers of the data that the Data and BI teams manage so therefore, they rely heavily on them for success.
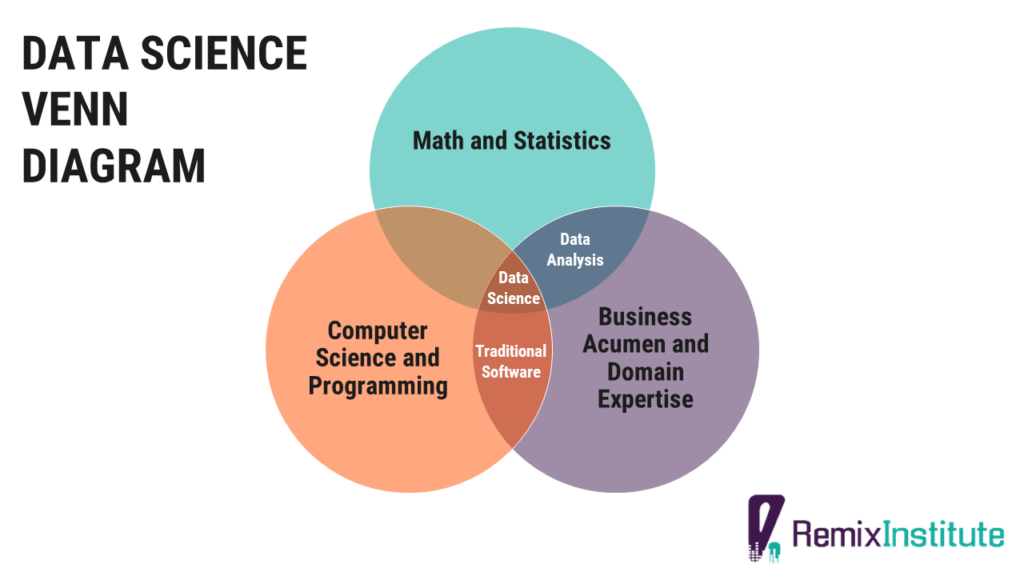
What is Data Science, Machine Learning, and AI?
Data Science is a catch-all term that means using scientific, mathematical, and statistical methods, processes, algorithms and systems to extract knowledge and insights from data.
The oft-cited Data Science Venn diagram is a good representation of who a Data Scientist is. A Data Scientist/Statistical Analyst/Machine Learning Engineer is one who possesses strong business acumen and domain expertise, statistical and machine learning skills, AI engineering skills, and computer programming skills. A Data Analyst is one who possesses strong business acumen and domain expertise, mathematics, and statistics skills.
Machine Learning, a subset of Artificial Intelligence, is the application of mathematical and computational statistics algorithms that improve automatically through experience. It involves building mathematical models based on sample data, known as “training data”, in order to make predictions or decisions without being explicitly programmed to do so, simulating the human learning and decision-making process. Machine Learning, in some business settings, is sometimes referred to as predictive analytics, and it’s used to augment human decision-making by automating high frequency decisions in a more efficient and accurate manner.
In addition to augmented decision-making, Machine Learning can also mean automation and more reliance on mathematics and technology and less on manual processes.
Artificial Intelligence is intelligence that is demonstrated by machines, software bots, or robots that simulates the intelligence of a human. The term is used to describe machines or computers that mimic cognitive functions of a human, such as learning and problem solving. It’s been an academic discipline since 1955, and applications of artificial intelligence include machine learning, natural language processing (contextual understanding of text and speech), large language models, image recognition, and computer vision. The academic field was founded on the assumption that human intelligence and cognition can be so precisely described that a machine can be made to simulate it. Machine Learning and Deep Learning are subsets of the field of Artificial Intelligence.
On the Business Value and Operational Necessity of Data Science, AI, and Machine Learning
Data Science and AI are becoming operational necessities for businesses, much like Sales and IT. According to McKinsey, AI and Machine Learning have the potential to create an additional $2.6T in value by 2020 in Marketing and Sales, and up to $2T in manufacturing and supply chain planning. McKinsey also found that 82% of enterprises adopting machine learning and AI have gained a financial return from their investments. With all of that value added, it’s no wonder spending on AI systems and software is projected to be $77.6B in 2022, more than three times the $24B in 2018. (Source)
The ROI of Data Science and Machine Learning can materially be felt in the P&L of any organization via the following common use cases:
- Cost savings and profit optimization from direct mail and email propensity modeling
- Product recommenders automate both labor and decision-making to provide the best products to customers at a personalized level. Product recommenders can yield gains in conversion rates and average order values
- Churn prediction modeling and Time-Til-Churn models built to A) retain customers and lower churn rates and B) predict the customer’s lifetime value in the future in order to determine if a customer is worth retaining
- Email propensity modeling to mitigate unsubscribe risk and improve deliverability rates
- Data science apps that can give executive overviews to high visibility channels
- Machine learning apps that forecast what sales are going to be in order to take proactive action
- AI Bots that can monitor business metric KPIs and alert the business if something goes wrong. This is an effort in stopping reactive ad hoc analyses to negative business events.
- AI Bots that can save hundreds of labor hours
What is the Analytics and Data Science Process Lifecycle via CRISP-DM?
The Analytics and Data Science Process Lifecycle is the standard workflow of a typical analytics or modeling project. It is common to use the CRISP-DM process model, which was developed by IBM. CRISP-DM breaks the process of data mining, analytics, and modeling into 6 phases:
- Business Understanding – This phase involves gathering the business requirements from relevant stakeholders such as what problems they’re looking to solve or what pain points they have.
- Data Understanding – This phase involves taking an inventory of what data is available by the business that’s needed to solve the problem addressed during the Business Understanding phase. This also involves abstraction of the data you’d need to build in order to provide a solution.
- Data Preparation – This phases involve all the data wrangling, data cleaning, data QA, imputations, handling of missing data, joins, derived columns, and many other steps. It’s been said that 80% of a data scientist and data analyst’s time is spent on the Data Preparation phase.
- Modeling – This phase involves building a statistical or machine learning model to solve the business problem addressed in the Business Understanding phase. This phase can also mean producing analytical insights from the data (not necessarily via statistical modeling) in order to solve the business problem or provide a recommendation based on those insights.
- Evaluation – This phase involves determining if your statistical or machine learning model produces accurate measurements in out-of-sample data and has real world application. This phase can also mean ensuring your analytical insights from the data (not necessarily derived via statistical modeling) are accurate and reliable.
- Deployment – This phase involves operationalizing your statistical/machine learning model into a production environment for consumption by the business, or it may involve deploying your analytical insights as strategic recommendation inputs for future business decision-making.

What is Intelligent Automation (IA) and Hyperautomation?
Intelligent Automation and Hyperautomation refers to the application of artificial intelligence (AI) and machine learning (ML) to increasingly automate processes and augment human cognition, productivity, and decision-making capabilities. Gartner calls it one of the top 10 strategic technology trends that promises to drive significant disruption and opportunity over the next decade. It’s crucial that any organization be at the vanguard of these advances.
You can learn more in-depth about these concepts by taking the 2-hour free course called Automation Essentials by WorkFusion Academy. Link to that course is in the Training Courses and Curriculum section in his document.
Here’s a fantastic article about how to bring AI Automation to your business – https://appsilon.com/want-to-build-an-ai-model-for-your-business-read-this/
One of the primary goals of hyperautomation is the creation of a digital twin – which in effect, means replicating a human’s cognitive and productivity throughput (without the overhead).
The next decade is the realization of what previous generations only imagined. Science fiction is now science.
Common Technology Stacks of Analytics and Data Science Teams
Generative AI Assistants
- Para from LegalMente AI
- ChatGPT from OpenAI
- Grok from xAI
![]()
![]()
![]()
No-Code Data Preparation, Data Analysis, and Automation Workflows
- Excel – Most commonly used no-code data analysis tool. Part of Microsoft Office.
- Alteryx – Commercial no-code data preparation and data analysis software.
- KNIME – Free no-code data preparation, data analysis, and data science software. You can download KNIME for free here.
- n8n
- Make
![]()
![]()
Databases
- Microsoft SQL Server and Azure SQL – Relational database management system developed by Microsoft. Microsoft SQL Server Management Studio (SSMS) is a software application to manage components of MS SQL Server that includes a script editor where you can execute SQL code. You can download Microsoft SQL Server Management studio for free here.
- PostgreSQL – A free, open-source relational database management system. You can download PostgreSQL for free here.
- Google Big Query – BigQuery is a fully managed data warehouse developed by Google.
- DBeaver – A free multi-platform database tool for developers, database administrators, analysts and all people who need to work with databases. You can download DBeaver for free here.
Data Visualization and Data Science Web Apps
- Microsoft PowerBI – Commercial data visualization software that’s interactive and focused on business intelligence and building KPI dashboards. Developed by Microsoft. You can get started for free with PowerBI by clicking on this link.
- Tableau – Commercial data visualization software that’s focused on business intelligence and building KPI dashboards. Owned by Salesforce.
- Shiny – Shiny is an open-source web framework for R that allows you to create interactive web applications, visualizations, and data science functionalities using R code. The difference between Shiny and PowerBI and Tableau is that it can integrate R and Python code and statistical and machine learning models that PowerBI and Tableau CANNOT do. While Tableau and PowerBI have some built-in R integration features, it’s limited to A) the R version that’s installed on Tableau and PowerBI (usually versions that are too old) and B) the R packages that come pre-installed in Tableau and PowerBI (usually very limited and either impossible or very difficult to add new ones without waiting on their company’s developers to make an upgrade). Shiny is also highly extensible and can integrate custom HTML, CSS, and JavaScript code. Anything that can be done on a web page or application can be done in Shiny. With PowerBI and Tableau, you’re limited to the platform’s canvas, functionalities, and features. You can download Shiny by running the following code in R:
install.packages("shiny"). Shiny apps can be hosted for free on www.Shinyapps.io

Data Science, Machine Learning and AI Software Development
- R – One of the most popular languages for data science, analytics, and AI. Free and open-source. You can get started with R in this free course.
- RStudio – An open-source IDE (integrated development environment) for R to develop and run R code. You can get started using RStudio in this free course
- Julia – One of the most popular languages for data science, machine learning, and AI. You can get started with Julia in this free course.
- Microsoft Visual Studio Code – An IDE (integrated development environment) for running and developing code. You can get started with Visual Studio in this free course.
- H2O – open source AutoML framework for R and Python. You can download H2O in R by running the following code:
install.packages("h2o")
Again, R, Julia, and H2O are free and open-source, demonstrating the low-cost, high ROI yield of data science operations.

Digital Marketing Analytics
- Google Analytics – Web analytics tool developed by Google that tracks and reports website traffic. You can get started using Google Analytics for your website for free by clicking here. You can access the Google Analytics API via the R package called
googleAnalyticsR - Google Search Console – Web service developed by Google that lets you check search page indexing status, search queries, crawling errors, and optimize the visibility of your website. You can get started using Google Search Console by clicking here. You can access the Google Search Console API via the R package called
searchConsoleR - SEMRush – Software that is used for keyword research and online ranking data and displays metrics related to search query volume and search query cost per click. SEMRush also has an API. To get started using SEMRush, click here.
Documentation and Version Control
- RMarkdown – Free, open source, and easy-to-use plain text language used to combine code (R, Python, Julia, SQL, etc), results from your data analysis (such as plots, charts, and tables), and written commentary into a nicely formatted, dynamic, and reproducible document (like a report or web page). Great for presentation and documentation. You can install RMarkdown in R by running following code:
install.packages("rmarkdown") - GitHub – Highly popular service for software development, bug tracking, feature requests, documentation, and version control. Owned by Microsoft.
- Confluence – Commercial software where teams can organize and share knowledge, information, and documentation all in one place. Owned by Atlassian.
Collaboration and Project Management
- Microsoft Teams – Microsoft Teams is a workspace chat and video conferencing software. You can download the Microsoft Teams desktop and mobile apps here.
- Slack – Slack is also a workspace chat software where you can create private chat rooms called “channels”. It also allows voice and video calls. Slack is owned by Salesforce.
- Trello – A Kanban-style, list-making application and project management software. Owned by Atlassian. One of the easiest project collaboration softwares available. You can get started with Trello for free here.
- Jira – Issue tracking and Agile project management software. Owned by Atlassian.
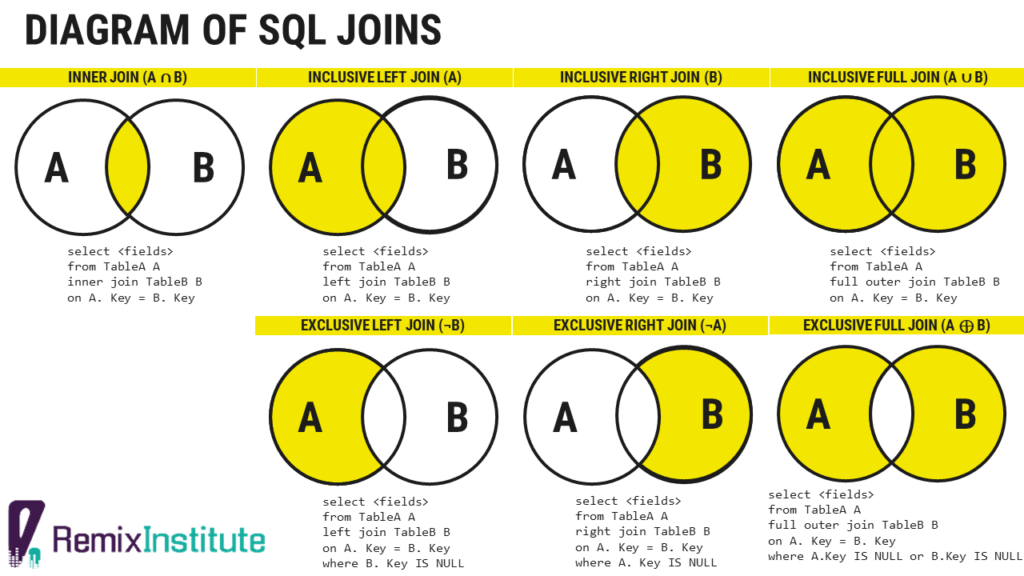
Diagram of SQL Joins
For a tutorial on SQL joins, see the “Introduction to SQL” course on the “Recommended Course Cadence” section below.
Remix Institute Philosophy, Business Axioms, and Cognitive Biases to Know
What are Axioms?
In mathematics, philosophy, and logic, an axiom is a statement or heuristic that is taken to be true, that serves as a premise or starting point for other reasoning until it is proven to be untrue otherwise.
Remix Institute’s Axiomatic System of Philosophies are designed to be axioms and heuristics that are so evident and well-established, that they have become immutable and have a high probability of withstanding the test of time.
Remix Institute’s Axioms with High Probability of Immutability
Occam’s Razor and Principle of Parsimony. Simplest model is the best model possible. Less is more. Complexity is the enemy of execution. This concept was first introduced in the 14th Century by William of Ockham, a Franciscan friar and theologican.
Remix Institute’s Pareto Optimal Project Management. Prioritize tasks or projects which have the highest payoff and highest ease of execution. Focus on the 20% of effects which will have 80% of the impact. Say “No” to many requests and target only essential tasks. The Pareto Principle was first introduced by the Italian economist, Vilfredo Pareto, in 1897. It was further established by the Romanian-born American engineer and management consultant, Joseph M. Juran, in 1941, where he referred to it as “the vital few and the trivial many.” The project management principle of this concept was first introduced by the PICK Chart, a Lean Six Sigma tool that was developed by Lockheed Martin engineers working on the F-35 program in the mid-1990s.
Remix Institute’s Polarisism. Focus. Focal point. Pole star. Polaris. Focus and concentrate on what’s truly important and let go of unnecessary distractions. Named after current northern pole star, Polaris, whose stable position of the star in the Northern Sky makes it useful for navigation. Find the Polaris and navigate towards that or you’ll be thrown off course. This is similar to the modern 2014 philosophy of Essentialism by the Mormon business strategist, Greg McKeown , which focuses on the idea of doing less but better, concentrating on what is truly essential, and eliminating non-essential activities and distractions. Here’s a good YouTube video from American entrepreneur, Alex Hormozi, on the topic – Why Most Things Aren’t Worth Doing
Dashboard Design Principles
- Single page applications trump multiple-paged and multiple-tabbed applications every time
- Pleasing aesthetics increase user adoption. Design for the user in mind.
- Do not duplicate information on your dashboard.
- Minimize the number of clicks a user has to make on your dashboard.
- If you’d like design feedback on a dashboard or app, ask a UI/UX resource at your company.
- Collect feedback from at least 5 users of your dashboard. Research has shown that 85% of your usability issues will be uncovered here. Links to that research can be found here and here.
Cognitive Biases in Business
- Planning Fallacy. This phenomenon refers to being unrealistically optimistic about predictions on how much time it will take to complete a task and underestimate the actual time it will take.
- Semmelweis Reflex. This is the reflex-like tendency of the stakeholder to reject new evidence or data because it contradicts established beliefs, assumptions, or paradigms.
- Escalation of Committment. This is used to describe the justification for increased investment or effort in a decision, based on the cumulative prior investments despite new evidence or data suggesting that the future cost of continuing the behavior outweighs the expected benefit. Also known as the “Sunk Cost Fallacy.”
- Anchoring. This is a cognitive bias where one depends too heavily on an initial piece of data or information to make subsequent judgments during decision making.
- Parkinson’s Law of Triviality. This refers to when members of an organization or team give disproportionate weight to trivial issues
- Halo Effect. This is when positive impressions of a person, company, or brand (such as a big name consulting company or ad agency) positively influence one’s opinion
- Ringelmann Effect. This is when members of a group become increasingly less productive as the size of their group increases. This happens a lot in big meetings.
- Chesterton’s Fence. This is the principle that changes should not be made until the reasoning behind the existing state of affairs is first understood
Business Principles for AI Models When Writing a Business Requirements Document (BRD) and Executing a Project
First, be aware of the Planning Fallacy
- The Planning Fallacy is the tendency to underestimate the time needed to complete a task. Projects typically take longer than planned.
- To counteract the Planning Fallacy, use Hofstadter’s Law: It always takes longer than you expect, even when you take into account Hofstader’s Law.
- This is a really great article on the Planning Fallacy by Trello that we recommend you read.
Time estimates are usually just that: estimates. Estimates can and do vary, and this should be expected.
- Time-to-completion has a large variance; you should add Standard Deviation to Expected Time-To-Completion to get a more realistic time frame.
- You can calculate Standard Deviation by Task Type by taking the standard deviation of the differences between the expected due dates and actual due dates.
- This will require Project Managers to document and calculate.
- For a simple heuristic, you should add 30 Days to the final expected deadline
You need to budget at least one month of testing after machine learning models are finished/deployed.
- Machine Learning model development and deployment are separate line items on the time budget
- Even this one month estimate budgeted for testing can vary
When the scope of a project or program changes as it’s being developed, you acquire Technical Debt.
- Technical Debt is the additional cost of re-working software or machine learning models by rushing to have an easy solution while not using a better approach that would take longer.
- Technical Debt usually gets acquired under programs with really tight deadlines or as changes are being made to the program as it’s being developed.
- If Technical Debt is not repaid, you accumulate “interest”, making it harder to implement new feature or changes later on.
- To ensure you don’t acquire Technical Debt, allow deadlines to be significantly extended for any new feature requests or changes that happen along the way.
New feature requests to a business project or program should have some data to justify the change.
- Simply adding in a new feature or business rule based on hypotheticals or theories may blunt the effectiveness of the current features and may cause negative customer behavior
- Some analysis or data should be presented as justification before a change to a project or program is initiated.
- Any feature request or business rule needed to be applied to a machine learning model should be tested in a small pilot or campaign first before being widely deployed across the business.
And finally, simpler frameworks are better and allow for future agile changes.
- Focus on building a minimum viable product and scale iteratively. We don’t have to have the perfect solution out of the gate.
- Use Occam’s Razor when designing new programs, features, or machine learning models. Complexity is the enemy of execution.
- Allow stakeholders the option of killing features of a program if it demonstrates to have high complexity / low value or if it negatively impacts the customer experience
Project Management Principles and Strategies
Reproducibility
Reproducibility is a critical tenet of data analysis, data science, and analytics operations. According to Colorado State University, reproducible analysis is the “practice of distributing all data, software source code, and tools required to reproduce the results” of an analysis. The need for reproducible analysis arises from some of the following scenarios:
- A business stakeholder or end-user inquires about an analysis or dashboard developed X months ago and requests that the analysis or dashboard be updated with current data or repeated with new data.
- The analyst who looked at the data X months ago or Y years ago is no longer available or is out on PTO/Sick/etc, and the business stakeholder or end-user asks for an analysis using the same methods the analyst used
- A business stakeholder, project manager, or senior executive calls into question the accuracy or reliability of the data and analysis presented. You need to be able to go back to the “paper trail” of your work to see how you arrived at the answer to quell those concerns, especially if the analysis was conducted a long time ago.
Reproducibility is also critical in establishing and maintaining trust from the stakeholders that the analysis was conducted reliably and accurately. We want to avoid phrases from stakeholders such as “there seems to be a discrepancy in the data” or “there’s a disconnect in the data.” Reproducibility takes time, but that extra time is critical in maintaining that trust.
What are some ways of creating Reproducibility?
Reproducibility can be broadly achieved by creating a project workflow using the following tools:
- Using Version Control – keeping track of changes in your documents and code is essential. Tools that you can track this in are Microsoft Word, GitHub, and Markdown.
- Using Automation – using scripts (SQL, R, Julia) helps automate computational tasks so you have a record or recipe of what you did
- Using Formulas in Excel – Using formulas such as sumifs(), countifs(), vlookups(), etc will help you and other users discover how you made your calculations. Hard coding numbers into Excel is anathema as there is no way for you or anybody else to know how you arrived at those numbers
- Using Analytic Workflows – tools like KNIME and Alteryx workflows help keep track of what steps you took to mine data for insights and dashboards
- Avoiding manual data manipulation steps
For a more exhaustive list of strategies for ensuring Reproducibility, click on this helpful blog post. I strongly encourage you to read it.
How should a Data Analysis Project be structured?
For any ad hoc analysis or project, we will broadly use the following Folder Structure guidelines:
- Main Folder: my_awesome_analysis_project
- Sub-folder – output
- Sub-folder – presentations
- Sub-folder – data
- Sub-folder – documentation
- README.md (or README.txt or README.docx)
- run_analysis.R (or run_analysis.jl or run_analysis.sql)
- Sub-folder – output
A description of each component of the Project Folder Structure is described below:
Main Folder – This is the name of the ad hoc analysis project you are working on.
output folder – This is where any summarized data, summarized charts and analysis, and PowerPoint presentations go. The contents of the “output” folder is typically the end product the business user receives
data folder – This is where any raw and processed data goes that’s typically output by a script or KNIME/Alteryx workflow. The contents of the “data” folder typically power the contents of the “output” folder. Sometimes, the “data” folder is not required as you may be connecting to and writing data to SQL database tables.
documentation folder – This folder contains any key documentation about the project. It can also contain emails, meeting notes, spreadsheets, PowerPoints, PDFs, etc provided by business units or a 3rd party to complete a given task.
README.md – This can also be a Word Doc or text doc. This is a key document you think would be needed for the project that you’d need to reference in the future. An example would be change requests from the business stakeholders. Providing a README.md is optional.
run_analysis.R – This can be an R script, Julia script, SQL script, or KNIME/Alteryx workflow that goes through all the data steps needed to produce your analysis. The filename “run_analysis” can be changed to whatever you want but should be intuitive enough for you or other users to know what it is
Pareto Optimal Project Management
Unfortunately, we don’t have infinite hours. Time is a scarce and valuable resource, and we’re limited to hours in the day. Also, we can’t work on multiple things all at once.
Therefore, a strategy must be adopted to prioritize which tasks get worked on first and which tasks are either unnecessary or non-value added.
Stakeholders tend to view all their projects as equally important as other Stakeholders. The reality is that some projects are more important than others and those take precedence above the rest.
When prioritizing tasks, the number one rule is that Production Tasks take highest priority. Those usually mean any data or model product which materially impacts revenue or a business process (such as machine learning models in production)
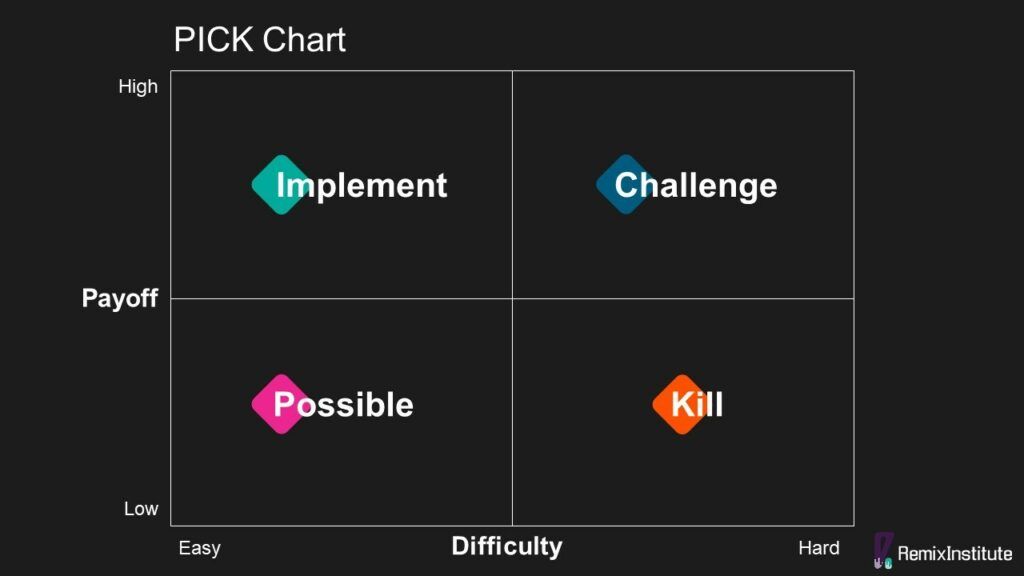
After Production Tasks, you’d need a framework for prioritizing the other tasks. The best framework to use is Pareto Optimal Project Management. It means focusing on the top 20% of projects that will deliver 80% of the value (the 80/20 rule). To find out which projects are Pareto Optimal, typically your manager assists with prioritization of projects, but it would involving using a PICK Chart. A PICK Chart is a Lean Six Sigma tool, developed by Lockheed Martin, for prioritization of features and projects.
By using Pareto Optimal Project Management, you pick to focus on and prioritize projects that have a high ease of execution and high business impact (top left quadrant). You kill projects that have a low ease of execution and low-to-no business impact (bottom right quadrant).
For more on Pareto Optimal Project Management, read this Remix Institute article here.
“Last Mile” Analytics
“Last Mile” Analytics is a contemporary industry term meaning delivering your analytics to the last mile in order to achieve a business outcome. It’s based off a concept in supply chain management referring to the movement of goods from a transportation hub to a final destination. It’s typically the costliest and most complicated part of delivery a product to a consumer.
To ensure success during the “Last Mile”, make the project about the decision, not the analytic or model.
In other words, business users need not waste time without an end game in mind. Every analytic project or model product must provide business value.
Excel Keyboard Shortcuts To 10x Your Productivity
coming soon
Training Courses and Curriculum
To succeed as a Data Scientist or Data Analyst, these courses and skills are needed.
Math and Statistics
- Statistics 101
- Introduction to Statistics in R by Michael Crawley.
- Statistical Quality Methods by Mark L Crossley.
- Correlation and Regression
- Linear Algebra 101
- https://faculty.iiit.ac.in/~mkrishna/PrincipalComponents.pdf
- Linear Algebra for Data Science in R, Julia, and Excel
- Machine Learning 101
- Intro to Machine Learning in R and Julia
- Machine Learning Tree-Based Models in R and Julia
- Econometric Time Series
- Time Series Forecasting using R and Julia
- https://otexts.com/fpp2/useful-predictors.html
- https://datajobs.com/data-science-repo/Time-Series-Tutorial-[Zucchini-and-Nenadic].pdf
- Unsupervised Machine Learning
- k-Means Clustering – http://www.learnbymarketing.com/methods/k-means-clustering/
- Principal Components Analysis – https://faculty.iiit.ac.in/~mkrishna/PrincipalComponents.pdf
- Survival Analysis
- There’s a chapter in the Introduction to Statistics in R by Michael Crawley that’s a good primer for Survival Analysis
- Automated Machine Learning (AutoML)
- Overview of H2O AutoML framework. – https://docs.h2o.ai/h2o/latest-stable/h2o-docs/automl.html
- Commercial software in this space are DataRobot and H2O Driverless AI, but they cost tens and hundreds of thousands of dollars per license per year. If you’re not a large organization who can afford that, it’s better to use H2O’s free, open-source AutoML framework.
Software and Tools
- Excel
- Teach Yourself Visually – Excel
- Data Analysis with Excel
- Pivot Tables in Excel
- SQL
- Introduction to SQL by W3 Schools
- R
- Best primer for getting started with R – Introduction to Data Preparation in R by Remyx Courses
- Data Visualization and Storytelling with ggplot2
- Efficient R Programming by Colin Gillespie
- Developing R Packages
- Alteryx
- Shiny
- Best primer for getting started with Shiny – https://shiny.rstudio.com/tutorial/written-tutorial/lesson1/
- Julia
- Best primer for getting started with Julia – Introduction to Data Preparation in Julia by Remyx Courses
- Free eBook – Julia Data Science
- Power BI
Version Control
- GitHub
- GitHub 101 – https://guides.github.com/activities/hello-world/
- How To Use GitHub Desktop to Push/Pull – https://www.r-bloggers.com/how-to-upload-your-r-code-on-github-example-with-an-r-script-on-macos/
- Semantic Versioning
- Change Logs
- Markdown
- Dillinger, a tool for Markdown editing – https://dillinger.io/
- Dillinger, a tool for Markdown editing – https://dillinger.io/
Other
-
- The 2011 movie Moneyball starring Brad Pitt and Jonah Hill. Based on the true story of the 2002 Oakland Athletics and how they used data and SABRmetrics to build a winning team against big budget teams like New York Yankees and Boston Red Sox.
- The 2004 movie Collateral starring Tom Cruise and Jamie Foxx. Discusses themes about adaptability, improvisation, and not waiting to take action until risk is 0%.
- Automation Essentials – Free 2-hour course by WorkFusion Academy that gives an overview of business concepts related to Robotic Process Automation (RPA), Intelligent Automation, Business Process Improvement, Machine Learning/AI, and HyperAutomation. – https://automationacademy.com/en/automation-essentials
- Application Programming Interface (APIs) 101 –
- Zapier – https://zapier.com/blog/apis-101/
- Josiah Parry – https://youtu.be/w4yHEQWct20
- Shell and Command Line for Data Science
- Springer Books. – During Covid-19, Springer Books made a number of their books available for free. Remix Institute has an R script that downloaded all of them which they can share with you. They include books on topics such as Behavioral Science and Psychology, Business and Economics, Business and Management, Computer Science, Economics and Finance, Engineering, Intelligent Technology and Robotics, Mathematics and Statistics, and Religion and Philosophy.
- Six Sigma Methods
- Statistical Quality Methods by Mark L. Crossley
LegalMente AI and ChatGPT for Learning Acceleration
To truly accelerate your learning, especially when it comes to learning about programming in R and Julia, it’s imperative to use Para developed by LegalMente AI or ChatGPT developed by OpenAI.
ChatGPT (which stands for generative pre-trained transformer) is an artificial intelligence chatbot that uses large language models (LLMs) to provide detailed responses and articulate answers to any question across many domains of knowledge.
You can start a free LegalMente AI account by clicking here.
Recommended Course Cadence
| Week | Course Title | Platform | Link |
|---|---|---|---|
| 1 | Data-Driven Decision-Making | Remyx Courses | https://www.remixinstitute.com/courses/data-driven-decision-making-dddm |
| 1 | CRISP-DM Data Science Process Model | Remyx Courses | https://www.remixinstitute.com/courses/crisp-dm-data-science-process-model |
| 1 | Pareto Principle | Remyx Courses | https://www.youtube.com/watch?v=0pVgBZmaZEU |
| 1 | How To Download and Install R | Remyx Courses | https://www.remixinstitute.com/courses/how-to-download-and-install-r/ |
| 1 | How To Download and Install Julia | Remyx Courses | https://www.remixinstitute.com/courses/how-to-download-and-install-julia/ |
| 2 | Introduction to SQL | W3 Schools | https://www.w3schools.com/sql/sql_intro.asp |
| 2 | Introduction to Data Preparation in R | Remyx Courses | https://www.remixinstitute.com/courses/introduction-to-data-preparation-in-r/ |
| 2 | Introduction to Data Preparation in Julia | Remyx Courses | https://www.remixinstitute.com/courses/introduction-to-data-preparation-in-julia/ |
| 3 | Automation Essentials (Robotic Process Automation and AI) | WorkFusion Academy | https://automationacademy.com/en/automation-essentials |
| 3 | Marketing Metrics 101 | Remyx Courses | Coming Soon. Get updates here: https://tally.so/r/w4rNJB |
| 3 | Cognitive Biases in Business | Remyx Courses | Coming Soon. Get updates here: https://tally.so/r/w4rNJB |
| 4 | Productivity Strategies – How To Say No | Remyx Courses |
Coming Soon. Get updates here: https://tally.so/r/w4rNJB Meanwhile, read this: https://www.remixinstitute.com/how-to-say-no-to-projects/ |
| 4 | Productivity Strategies – Prompt Engineering for ChatGPT | Remyx Courses | https://www.remixinstitute.com/courses/introduction-to-prompt-engineering/ |
| 4 | Data Analysis and Pivot Tables in Excel | Remyx Courses | Coming Soon. Get updates here: https://tally.so/r/w4rNJB |
| 5 | Introduction to Statistics in R | Remyx Courses | Coming Soon. Get updates here: https://tally.so/r/w4rNJB |
| 5 | Introduction Statistics in Julia | Remyx Courses | Coming Soon. Get updates here: https://tally.so/r/w4rNJB |
| 5 | RFM Analysis in R | Remyx Courses | Coming Soon. Get updates here: https://tally.so/r/w4rNJB |
| 5 | RFM Analysis in Julia | Remyx Courses | Coming Soon. Get updates here: https://tally.so/r/w4rNJB |
| 6 | Stock Technical Analysis in R | Remyx Courses | Coming Soon. Get updates here: https://tally.so/r/w4rNJB |
| 6 | Stock Technical Analysis in Julia | Remyx Courses | Coming Soon. Get updates here: https://tally.so/r/w4rNJB |
| 6 | Correlation and Regression in R | Remyx Courses | Coming Soon. Get updates here: https://tally.so/r/w4rNJB |
| 6 | Correlation and Regression in Julia | Remyx Courses | Coming Soon. Get updates here: https://tally.so/r/w4rNJB |
| 7 | Occam’s Razor, the Principle of Parsimony, and the Japanese Art of Shikake | Remyx Courses | Coming Soon. Get updates here: https://tally.so/r/w4rNJB |
| 7 | GitHub 101 | GitHub | https://guides.github.com/activities/hello-world/ |
| 7 | Data Visualization and Storytelling in R | Remyx Courses | Coming Soon. Get updates here: https://tally.so/r/w4rNJB |
| 7 | Data Visualization and Storytelling in Julia | Remyx Courses | Coming Soon. Get updates here: https://tally.so/r/w4rNJB |
| 7 | Introduction to PowerBI | Microsoft | https://learn.microsoft.com/en-us/training/modules/introduction-power-bi/ |
| 7 | Shiny 101 | RStudio | https://shiny.rstudio.com/tutorial/written-tutorial/lesson1/ |
| 8 | Forecasting in R | Remyx Courses | Coming Soon. Get updates here: https://tally.so/r/w4rNJB |
| 8 | Forecasting in Julia | Remyx Courses | Coming Soon. Get updates here: https://tally.so/r/w4rNJB |
| 8 | Machine Learning in R | Remyx Courses | Coming Soon. Get updates here: https://tally.so/r/w4rNJB |
| 8 | Machine Learning in Julia | Remyx Courses | Coming Soon. Get updates here: https://tally.so/r/w4rNJB |
| 9 | Linear Algebra for Data Science | Remyx Courses | Coming Soon. Get updates here: https://tally.so/r/w4rNJB |
| 9 | Sales Skills for Data Science and AI | Remyx Courses | Coming Soon. Get updates here: https://tally.so/r/w4rNJB |
| 9 | Application Programming Interfaces (APIs) 101 |
Zapier Josiah Parry |
|
| 10 | Samurai Philosophy in Data Science | Remyx Courses | Coming Soon. Get updates here: https://tally.so/r/w4rNJB |
| 10 | Six Sigma and Continuous Process Improvement Tools | Remyx Courses | Coming Soon. Get updates here: https://tally.so/r/w4rNJB |
| 10 | k-Means Clustering in R | Remyx Courses | Coming Soon. Get updates here: https://tally.so/r/w4rNJB |
| 10 | k-Means Clustering in Julia | Remyx Courses | Coming Soon. Get updates here: https://tally.so/r/w4rNJB |
| 11 | Natural Language Processing in R | Remyx Courses | Coming Soon. Get updates here: https://tally.so/r/w4rNJB |
| 11 | Natural Language Processing in Julia | Remyx Courses | Coming Soon. Get updates here: https://tally.so/r/w4rNJB |
| 12 | Interview and Job Search Strategies for Data Science and AI | Remyx Courses | https://www.remixinstitute.com/courses/interview-preparation-and-strategy/ |
| 12 | LinkedIn Profile Optimization | Remyx Courses | Coming Soon. Get updates here: https://tally.so/r/w4rNJB |
Change Log
All notable changes to this guide will be documented in the Change Log.
The format is based on Keep a Changelog, and this project adheres to Semantic Versioning.